Peer Intelligence | Spring 2023
Was 2022 a good year to be active?
By Chris Flynn
As Rashay covers in his letter, the average net value added in CEM’s global investment database over the past three decades has been 16 bps, or 0.15% per year. While the long-term average doesn’t move much year to year, the average NVA each year can be significantly lower or higher. There are ‘better’ and ‘worse’ years for active management in the database, both at a total fund level, and within asset classes. While individual funds have a range of results, there seem to be some common strategies to the institutional investors in our database that perform better or worse in a given year.
The deadline for survey submissions in our U.S. defined contribution (DC) database was early April 2023. While most of that data is still under review, we’ve looked to see whether 2022 was a good or bad year for active managers of public stock portfolios.
We base these ‘early bird’ 2022 results on 270 actively managed stock options already contained in our DC database, recognizing that we are looking for a general trend as individual data points may be adjusted during the data review process (and more data is coming). We will also look back at 2020 and 2021 as a basis for comparison.

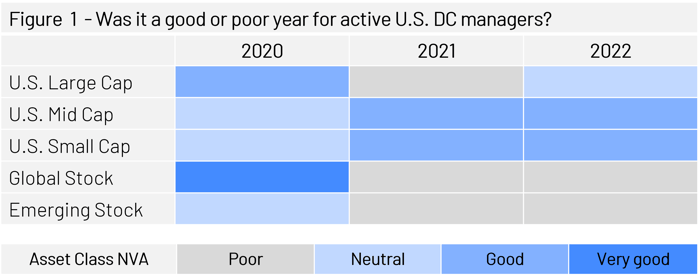
In Figure 1, a ‘good’ year occurs when two-thirds or more of options have positive NVA; a ‘poor’ year has only one-third positive NVA. Broadly speaking, average NVA matches these trends, being more strongly positive in ‘good’ years and negative in ‘poor’ years. Average NVA in a ‘neutral’ year for all active options is within 10 bps of zero, while a ‘good’ year might have average NVA above 20 bps in the category, and a bad one -20 bps or worse.
At this point, 2022 is looking like a bit of a repeat of 2021 for active stock managers. For early reporting DC sponsors, active U.S. Large Cap is ‘neutral’ with half of active portfolios outperforming their benchmarks, and half underperforming. It appears to have been a good year for active managers in both U.S. Small and Mid-Cap stocks with average NVA hovering in the low 0.2% range. Meanwhile, active managers in Global and Emerging equity underperformed their benchmarks. Apart from some improvement in U.S. Large Cap, this mirrors 2021’s results.
Worth noting: 2020 was a very different year, as non-U.S. stock and U.S. Large Cap were the winners in adding value over benchmarks. Global stock managers in 2020 had an average NVA of close to 80 bps, a gain that more than offsets the negative NVA in 2021 and 2022. By contrast, 2020 was a neutral year for U.S. Small and Mid-Cap.
While 1, 3, and 5-year time periods are much too short to assess whether active management is an appropriate approach in an asset class, it is useful to know how successful active management was in a given year to provide context for understanding your own results. As CEM’s 2022 database begins to take shape, funds will begin to obtain greater clarity on where their own success or struggles fit in.
Peer Intelligence | Spring 2023
